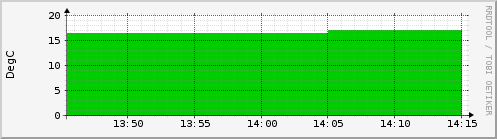
| Max floor | 1.5 DegC (1.9%) | Average floor | 1.3 DegC (1.6%) | Current floor | 1.0 DegC (1.2%) | ||
| Max ceiling | 2.0 DegC (2.5%) | Average ceiling | 1.5 DegC (1.9%) | Current ceiling | 2.0 DegC (2.5%) |
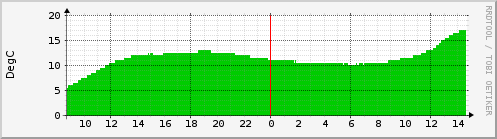
| Max floor | 9.5 DegC (11.9%) | Average floor | 5.7 DegC (7.1%) | Current floor | 1.0 DegC (1.2%) | ||
| Max ceiling | 11.5 DegC (14.4%) | Average ceiling | 6.4 DegC (8.0%) | Current ceiling | 2.0 DegC (2.5%) |
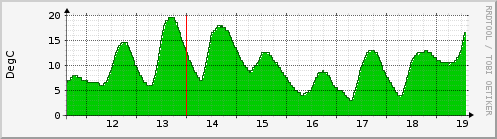
| Max floor | 17.1 DegC (21.4%) | Average floor | 7.8 DegC (9.8%) | Current floor | 1.5 DegC (1.9%) | ||
| Max ceiling | 20.0 DegC (25.0%) | Average ceiling | 7.1 DegC (8.9%) | Current ceiling | 1.5 DegC (1.9%) |
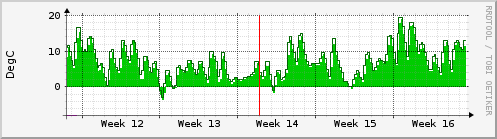
| Max floor | 16.9 DegC (21.1%) | Average floor | 4.4 DegC (5.5%) | Current floor | 2.5 DegC (3.1%) | ||
| Max ceiling | 19.4 DegC (24.2%) | Average ceiling | 4.2 DegC (5.2%) | Current ceiling | 2.8 DegC (3.5%) |
| Max floor | 34.4 DegC (43.0%) | Average floor | 12.1 DegC (15.1%) | Current floor | 6.8 DegC (8.5%) | ||
| Max ceiling | 26.3 DegC (32.9%) | Average ceiling | 5.5 DegC (6.9%) | Current ceiling | 7.6 DegC (9.5%) |
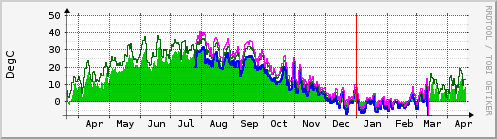
| GREEN ### | floor |
| BLUE ### | ceiling |
| DARK GREEN ### | floor peak |
| MAGENTA ### | ceiling peak |
| version 2.9.17 | Tobias Oetiker <oetiker@ee.ethz.ch> |
| and Dave Rand <dlr@bungi.com> | |
| mrtg-rrd.cgi version 0.7 | Jan "Yenya" Kasprzak <kas@fi.muni.cz> |