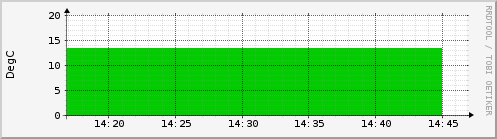
| Max L1 | 13.0 DegC (13.0%) | Average L1 | DegC (13.0%) | Current L1 | DegC (13.0%) | ||
| Max L2 | 13.0 DegC (nan%) | Average L2 | 13.0 DegC (nan%) | Current L2 | DegC (nan%) |
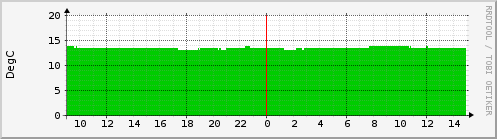
| Max L1 | 12.7 DegC (13.0%) | Average L1 | DegC (12.7%) | Current L1 | DegC (13.0%) | ||
| Max L2 | 13.0 DegC (nan%) | Average L2 | 13.0 DegC (nan%) | Current L2 | DegC (nan%) |
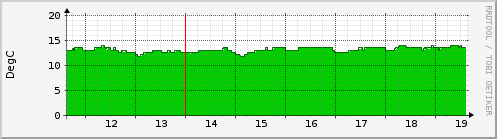
| Max L1 | 13.1 DegC (14.4%) | Average L1 | DegC (13.1%) | Current L1 | DegC (13.0%) | ||
| Max L2 | 14.4 DegC (nan%) | Average L2 | 13.0 DegC (nan%) | Current L2 | DegC (nan%) |
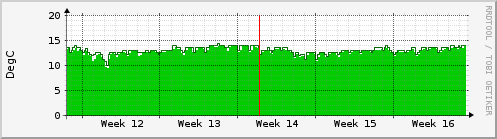
| Max L1 | 12.9 DegC (14.2%) | Average L1 | DegC (12.9%) | Current L1 | DegC (12.7%) | ||
| Max L2 | 14.2 DegC (nan%) | Average L2 | 12.7 DegC (nan%) | Current L2 | DegC (nan%) |
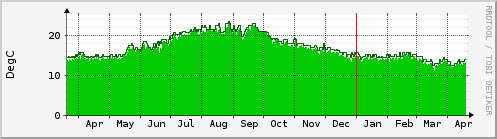
| Max L1 | 15.9 DegC (22.3%) | Average L1 | DegC (15.9%) | Current L1 | DegC (12.4%) | ||
| Max L2 | 22.3 DegC (nan%) | Average L2 | 12.4 DegC (nan%) | Current L2 | DegC (nan%) |
| GREEN ### | L1 |
| BLUE ### | L2 |
| DARK GREEN ### | L1 peak |
| MAGENTA ### | L2 peak |
| version 2.9.17 | Tobias Oetiker <oetiker@ee.ethz.ch> |
| and Dave Rand <dlr@bungi.com> | |
| mrtg-rrd.cgi version 0.7 | Jan "Yenya" Kasprzak <kas@fi.muni.cz> |